Seller Central Shows You Sales. It Does Not Show You Profit.
Open the Seller Central sales dashboard and you get a number that feels like performance: ordered product sales, units, sessions, conversion. It is a real number. It is also the wrong one to run a business on, because almost every cost that decides whether you keep any of that money lands somewhere else — in a settlement report two weeks later, in an advertising console with its own attribution window, in a storage invoice, in a returns file, in a supplier invoice Amazon has never seen.
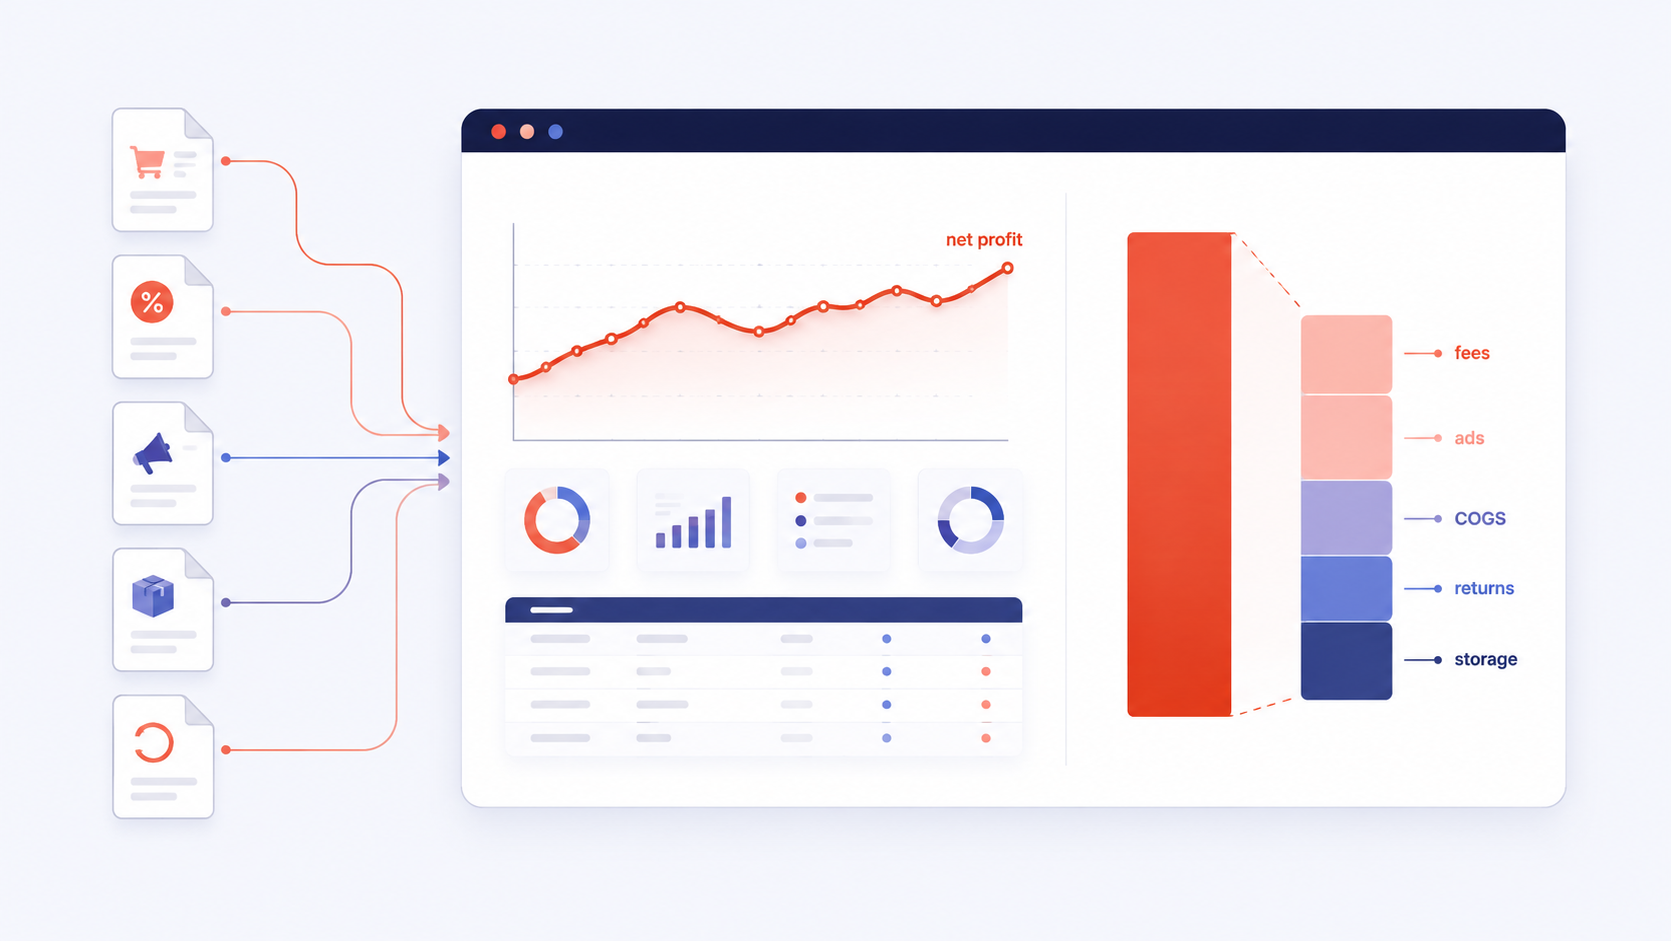
That gap is why Amazon profit tracking exists as a tool category at all. A profit tracker reassembles the pieces — fees, ad spend, COGS, returns, storage, reimbursements — and expresses them as one figure per ASIN, per day, that you can actually act on. A good Amazon profit dashboard then makes that figure current enough to change a decision this week rather than confirm a loss next month.
"Every seller I have worked with who thought they had a PPC problem and actually had a margin problem had the same setup: a sales dashboard they checked daily and a profit spreadsheet they updated monthly. The two never met in time to stop anything."
— Maya Patel, PPC & Advertising Specialist
This guide is about the tooling and the dashboard, not the arithmetic. If you want the formula itself — every layer of the cost stack with a worked example — read our Amazon true profit calculation guide first. Here we cover what a profit tracker has to display to be worth paying for, the four ways sellers track profit and what each one really costs, the metrics that separate a profit analyzer from a sales report, and how to choose between the tools ranked on our Amazon profit analytics page.
The four blind spots in a raw sales dashboard
Amazon does not know your COGS
Unit cost, inbound freight, duty and tariffs, prep and packaging never enter Seller Central. Until you load them, every margin figure you see is gross, not net — and if your landed cost has moved between shipments, a single average makes recent batches look better or worse than they are.
Ad spend sits in a different system
Sponsored Products, Brands and Display report on their own attribution windows, and spend on one ASIN routinely drives sales of another. Profit per ASIN is only meaningful once ad cost is allocated back to the unit — which is exactly what the sales dashboard does not do.
Returns land after the sale
A refunded order reverses revenue but rarely reverses the full cost: you may keep the referral-fee refund yet still carry the return processing, the inbound and outbound shipping already spent, and a unit that comes back unsellable. Point-in-time sales views flatter high-return categories such as apparel.
Storage and periodic fees hit later
Monthly storage, aged-inventory surcharges, removals and disposals arrive on their own cycle, weeks after the units they relate to sold or failed to sell. Assigning them back to the ASIN that caused them is the difference between a profit report and a bank-balance guess.
What an Amazon Profit Dashboard Must Actually Show
Most tools in this category will show you a net profit number. The spread in usefulness comes from how that number is built and how far you can drill into it. When we evaluate a profit tracker for the profit analytics category, these are the ten things we look for — in roughly the order they change decisions.
1. Net profit per ASIN, not just per account
Account-level profit hides the product that is subsidising the rest. The unit of decision is the ASIN — and for sellers with size or colour variations, the child ASIN, because one variation can be the entire loss.
2. Per-unit contribution margin
Sale price minus everything that varies with the unit: referral fee, FBA fulfilment fee, landed COGS, allocated ad cost, expected return cost. This is the number that tells you whether selling one more unit helps or hurts.
3. Ad spend allocated to the product
Not just total ACoS, but spend attributed down to the ASIN — and ideally TACoS, which measures ad spend against total sales rather than ad-attributed sales, so you can see whether ads are buying organic momentum or replacing it.
4. COGS by batch, not one flat average
Landed cost moves with freight rates, order quantity and duty. A tracker that accepts per-shipment cost and applies it FIFO will tell you the truth about the units actually selling; a single lifetime average will not.
5. Returns and refunds as a cost line
Return rate by ASIN, the net cost of each return, and what share of returned units come back sellable. In high-return categories this line alone can decide whether a product is viable.
6. Storage and aged-inventory costs, assigned back
Monthly storage, aged-inventory surcharges, removals and disposals attributed to the SKU that incurred them. Slow movers look profitable per unit right up until the carrying cost is put next to them.
7. A real-time or near-real-time view
Settlement-only reporting means you learn about a bad fortnight after it is over. Check how often the tool refreshes orders and ad data, and whether today's figure is an estimate or waits for settlement — both are legitimate, but you need to know which you are reading.
8. Anomaly alerts, not just charts
A dashboard you have to remember to open is a dashboard you will stop opening. Alerts for a margin drop, a silent ASIN, a fee change or a spike in return rate are what turn tracking into action.
9. Multi-marketplace and multi-currency roll-up
If you sell in more than one marketplace, profit has to consolidate into one reporting currency at a stated FX treatment. Otherwise you are comparing a strong month in Europe against a weak one at home and calling it growth.
10. Cohort and repeat-purchase view
For consumables and Subscribe & Save products, first-order margin understates the product. A tracker that shows repeat rate and profit by customer cohort is where LTV analytics and profitability actually meet — and it changes how much you are willing to pay to acquire the first order.
One more item that is not a metric but decides whether you keep using the tool: reimbursement visibility. Lost, damaged and incorrectly-weighed units are recoverable, and a profit tracker that flags the discrepancy at least tells you where to look. Dedicated recovery tools go further — we cover those separately in our guide to Amazon FBA reimbursement tools.
Four Ways to Track Amazon Sales and Profit, Compared
There are four realistic setups for tracking Amazon product sales and the profit underneath them. The right one depends far more on your SKU count and how fast you need the number than on your revenue. Price ranges below are our own observations of publicly listed entry pricing across the profit-analytics tools we track, as of August 2026; individual pricing changes often and usually scales with monthly order volume, so confirm current figures with each provider.
| Approach | How current the number is | Typical cost (Aug 2026) | Best for |
|---|---|---|---|
| Spreadsheet + manual reports | As current as your last update — in practice monthly | Free, plus several hours a month of your time | Under roughly 10 SKUs, one marketplace, light ad spend |
| Seller Central reports only | Settlement-paced; fees are accurate but COGS and ads are missing | Included with your selling plan | Reconciliation and tax records — not day-to-day decisions |
| Dedicated profit tracker | Daily to near-real-time, with ad spend and COGS built in | Entry plans across the tools we track ran from about $19/mo to $97/mo | Most FBA sellers past a handful of SKUs or any meaningful ad spend |
| BI stack or data warehouse | Whatever you build — typically daily pipelines | Tool cost plus real engineering time | Multi-brand operations blending Amazon with other channels |
Ranges are our observations of publicly listed entry-tier pricing across the profit-analytics tools reviewed on AMZToolHub as of August 2026, not quotes from any single provider. Most vendors price by monthly order volume, so your tier may differ.
The honest version of the spreadsheet option: it works, and it stops working suddenly. The failure point is not accuracy, it is cadence — a spreadsheet updated once a month cannot catch a fee reclassification, a competitor's price move or a campaign that started overspending on the 6th. By the time the row is filled in, the decision it would have informed is three weeks old.
It is also worth separating two categories that get used interchangeably. A profit tracker answers "what did I actually make, per ASIN, right now." A broader business analytics platform answers "what is happening across my whole operation" — inventory, customers, channels, forecasting — and typically treats profit as one module among several. Most sellers need the first and think they need the second; we break down the difference on the Amazon business analytics tools page.
How to Choose an Amazon Profit Tracker: 8 Checks
Nearly every tool in this category will demo well, because a clean chart of a good month looks the same everywhere. These are the questions we put to each one, and the answers vary far more than the marketing pages suggest. Run them during the free trial with your own data, not on the demo account.
The trial checklist
1. How fresh is today's number, and is it estimated?
Ask specifically how often orders and ad spend refresh, and whether today's profit is an estimate that later reconciles against settlement. Both approaches are defensible; silently mixing them is not.
2. Can it hold a different cost per shipment?
Load two batches of the same SKU at different landed costs and check whether the tool applies them in order or averages them. With freight and tariffs moving, this single behaviour can shift reported margin by several points.
3. How is ad spend attributed to an ASIN?
Check whether Sponsored Brands and Display are included or only Sponsored Products, and how spend on a campaign covering several ASINs is split. Ask what happens to spend that generated no attributed sale — it still came out of your margin.
4. Does a refund reverse the full cost, or only revenue?
Refund a test order and watch what the profit line does. The correct behaviour reverses revenue, keeps the fulfilment cost you already paid, and reflects whether the unit returned to sellable inventory.
5. What triggers an alert, and where does it go?
Margin below a threshold, a fee change, a listing going quiet, a return-rate spike — and delivered by email, push or Slack rather than waiting inside the dashboard for you to come and find it.
6. How does pricing scale as you grow?
Most vendors price on monthly order volume, so the entry tier is rarely the tier you stay on. Price your expected volume twelve months out, and check whether extra marketplaces or user seats cost more.
7. Can you get your data back out?
CSV export at minimum, an API or accounting integration ideally. Your COGS history is the expensive part to rebuild, and it is the thing you will want to carry to the next tool or to your accountant.
8. Does it handle every account you run?
If you run several brands, regions or client accounts, check whether they consolidate into one view or need separate subscriptions. This is where per-account pricing quietly becomes the largest line in the decision.
A practical sequencing note. Do not evaluate three tools at once — you will end up comparing onboarding experiences rather than numbers. Load COGS into one, run it alongside your existing spreadsheet for a full settlement cycle, and reconcile the two at the end. Where they disagree, one of them is wrong about a cost line, and finding out which is the most valuable thing the trial produces.
Compare Amazon Profit Analytics Tools Side by Side
We scored the leading Amazon profit trackers and dashboards against the same criteria — data freshness, COGS handling, ad attribution, alerts, multi-account support and published pricing — so you can shortlist two before you spend a trial on any of them.
On our sourcing: Price ranges in this article are our own observations of publicly listed entry-tier pricing across the Amazon profit-analytics tools reviewed on AMZToolHub as of August 2026; they are ranges across several providers rather than quotes from any single one, most vendors price by monthly order volume, and pricing changes frequently — confirm current figures and plan limits directly with each provider. The evaluation criteria and setup sequence reflect AMZToolHub's editorial approach and hands-on selling experience, not accounting, tax or financial advice. Fee behaviour described here is general to FBA and can differ by marketplace, category and program; verify the specifics for your account in Seller Central. Margin figures used as illustrations are examples, not benchmarks.
About the Author: Maya Patel
Maya is AMZToolHub's PPC & Advertising Specialist. She has managed over $18M in Amazon ad spend across 80+ brands and tests every major advertising and analytics tool so sellers don't have to.